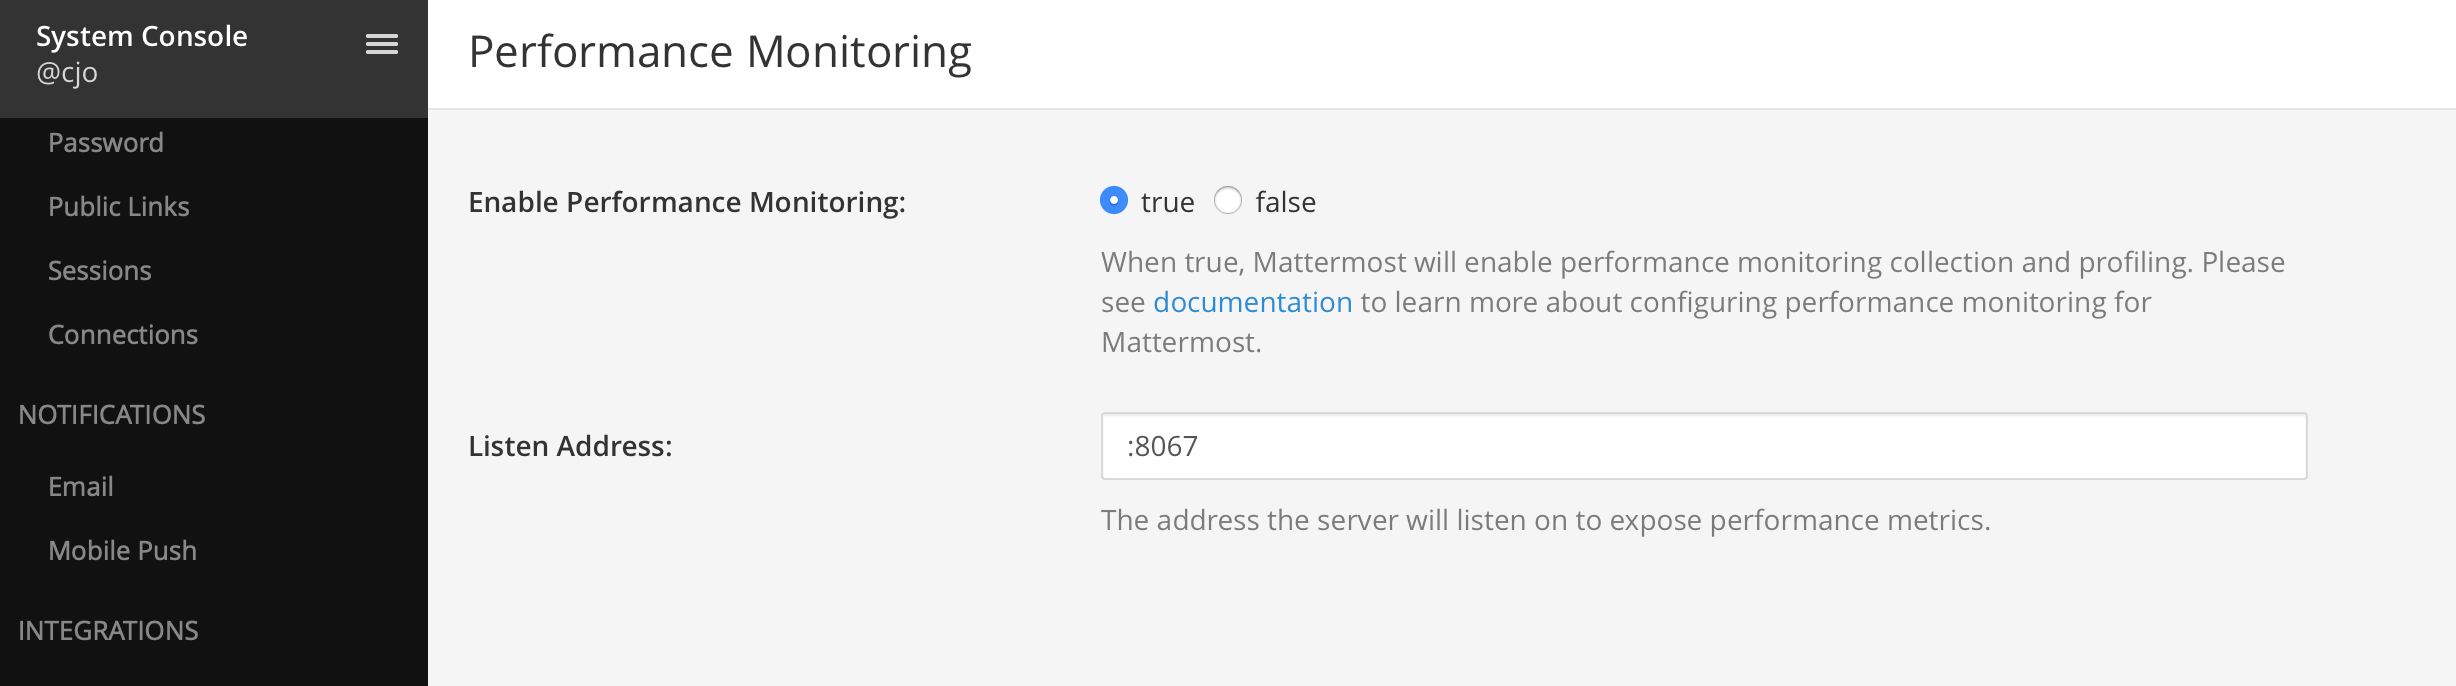
Last week I got a question around monitoring a Mattermost environment using Splunk. As you might know we have a metrics interface which can be used to scrape data with Prometheus and display the results in Grafana (official documentation). Since most of my customers already use Splunk I had to figure out a way to ingest data to Splunk.
Splunk does not support polling out of the box which makes it hard to connect to the metrics URL http://Mattermost:8067/metrics directly but there’s a support for scripted inputs.
This type is supported directly on the Splunk server or on the universal forwarder which gives you some options in terms of network restrictions.
- Splunk server -> Connect to Mattermost server -> Input Data
- Splunk forwarder on Mattermost server -> Forward Data
If your Splunk server is not allowed to poll the Mattermost metrics port, installing the Forwarder on the Mattermost servers could be an option. Let me show you how this works:
First we have to write a small script (direct.py) that gathers the data from the /metrics interface with an easy http request:
import requests

url = 'http://192.168.1.20:8067/metrics'

response = requests.get(url)

print response.content
As you can see no authentication is necessary which makes it a really simple script. Now we have to place it in the scripts directory of the server (/opt/splunk/bin/scripts) or the forwarder (/opt/splunkforwarder/bin/scripts). To validate that the result is delivered you can easily run the script on the server using python,
python direct.py
which should result in a few metric lines like these:
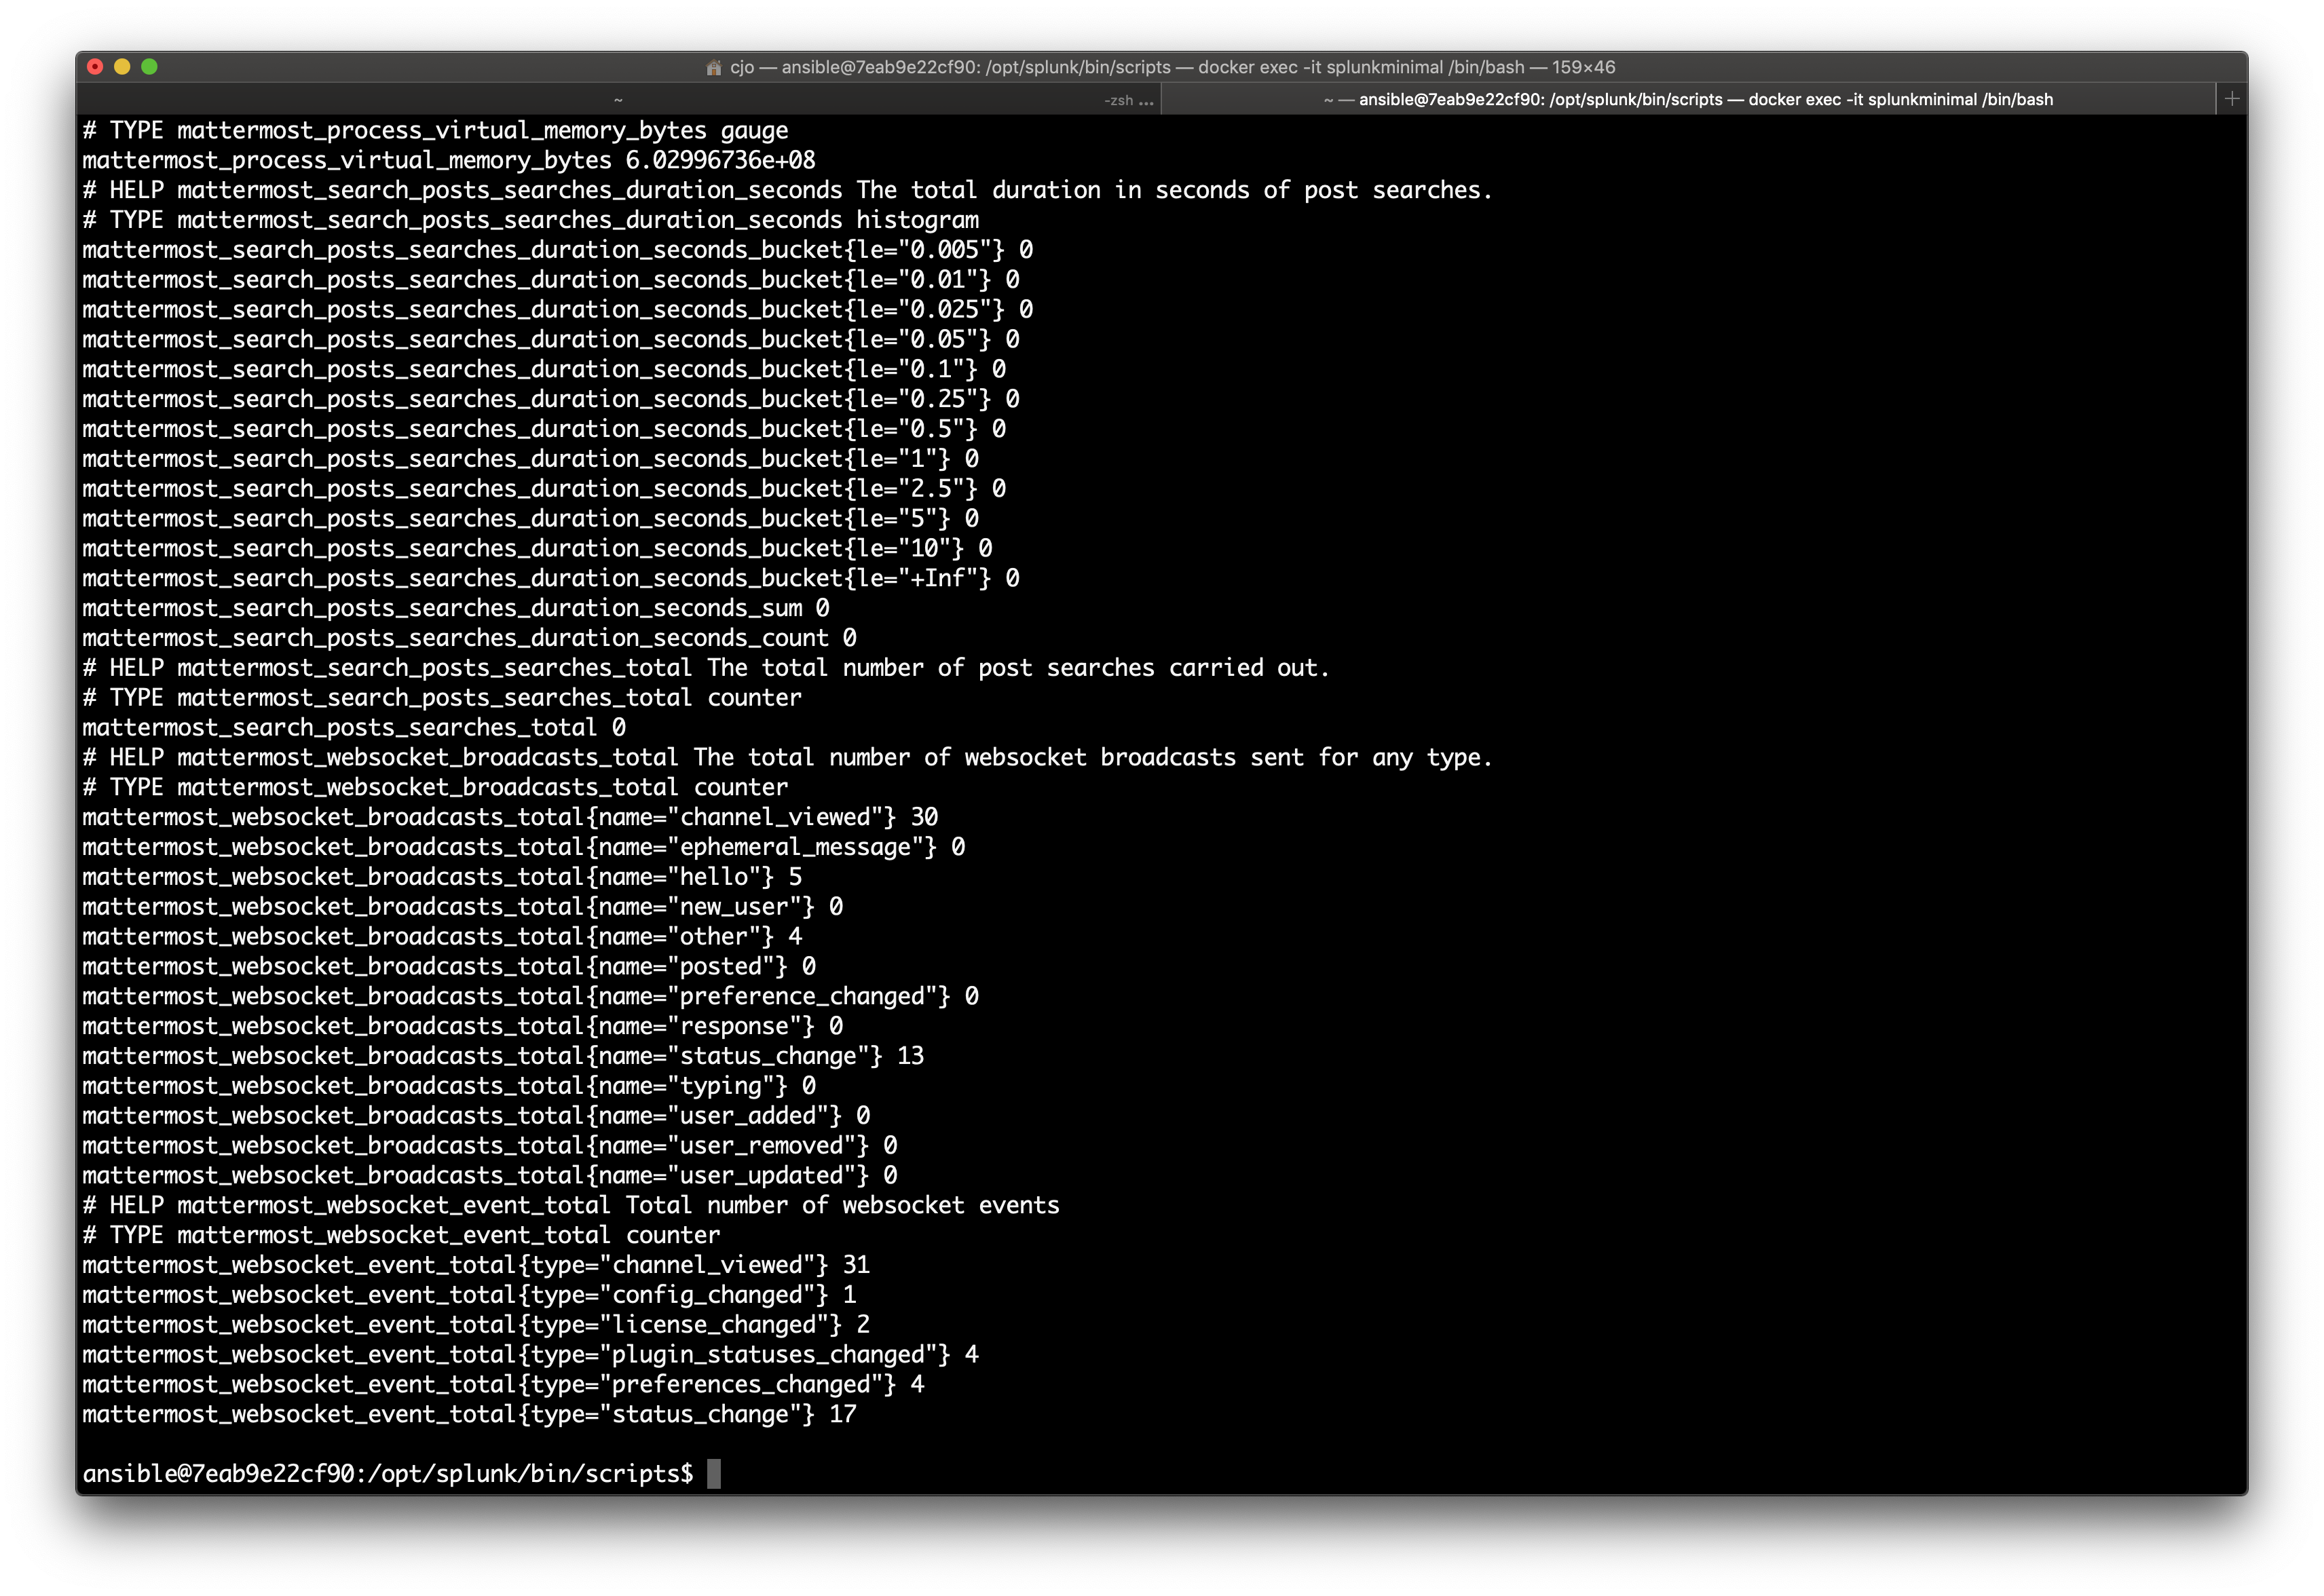
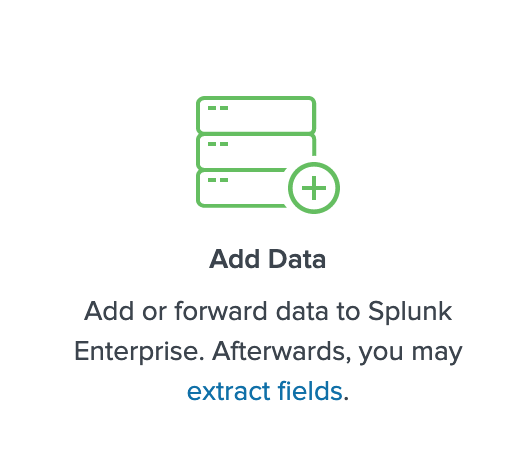
Know that we confirmed the proper function of the script we can start to configure the Splunk scripted input (Splunk server in this example). From the start screen you have to pick “Add data” and then “Monitor”:
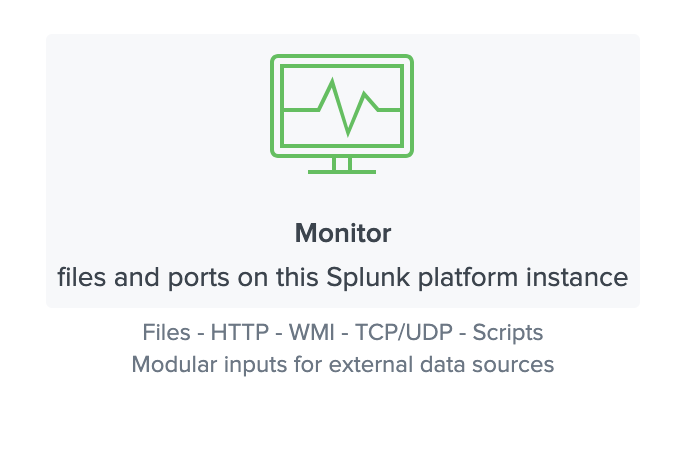
Now you can select the script and configure the details (recurrence, source name etc.):
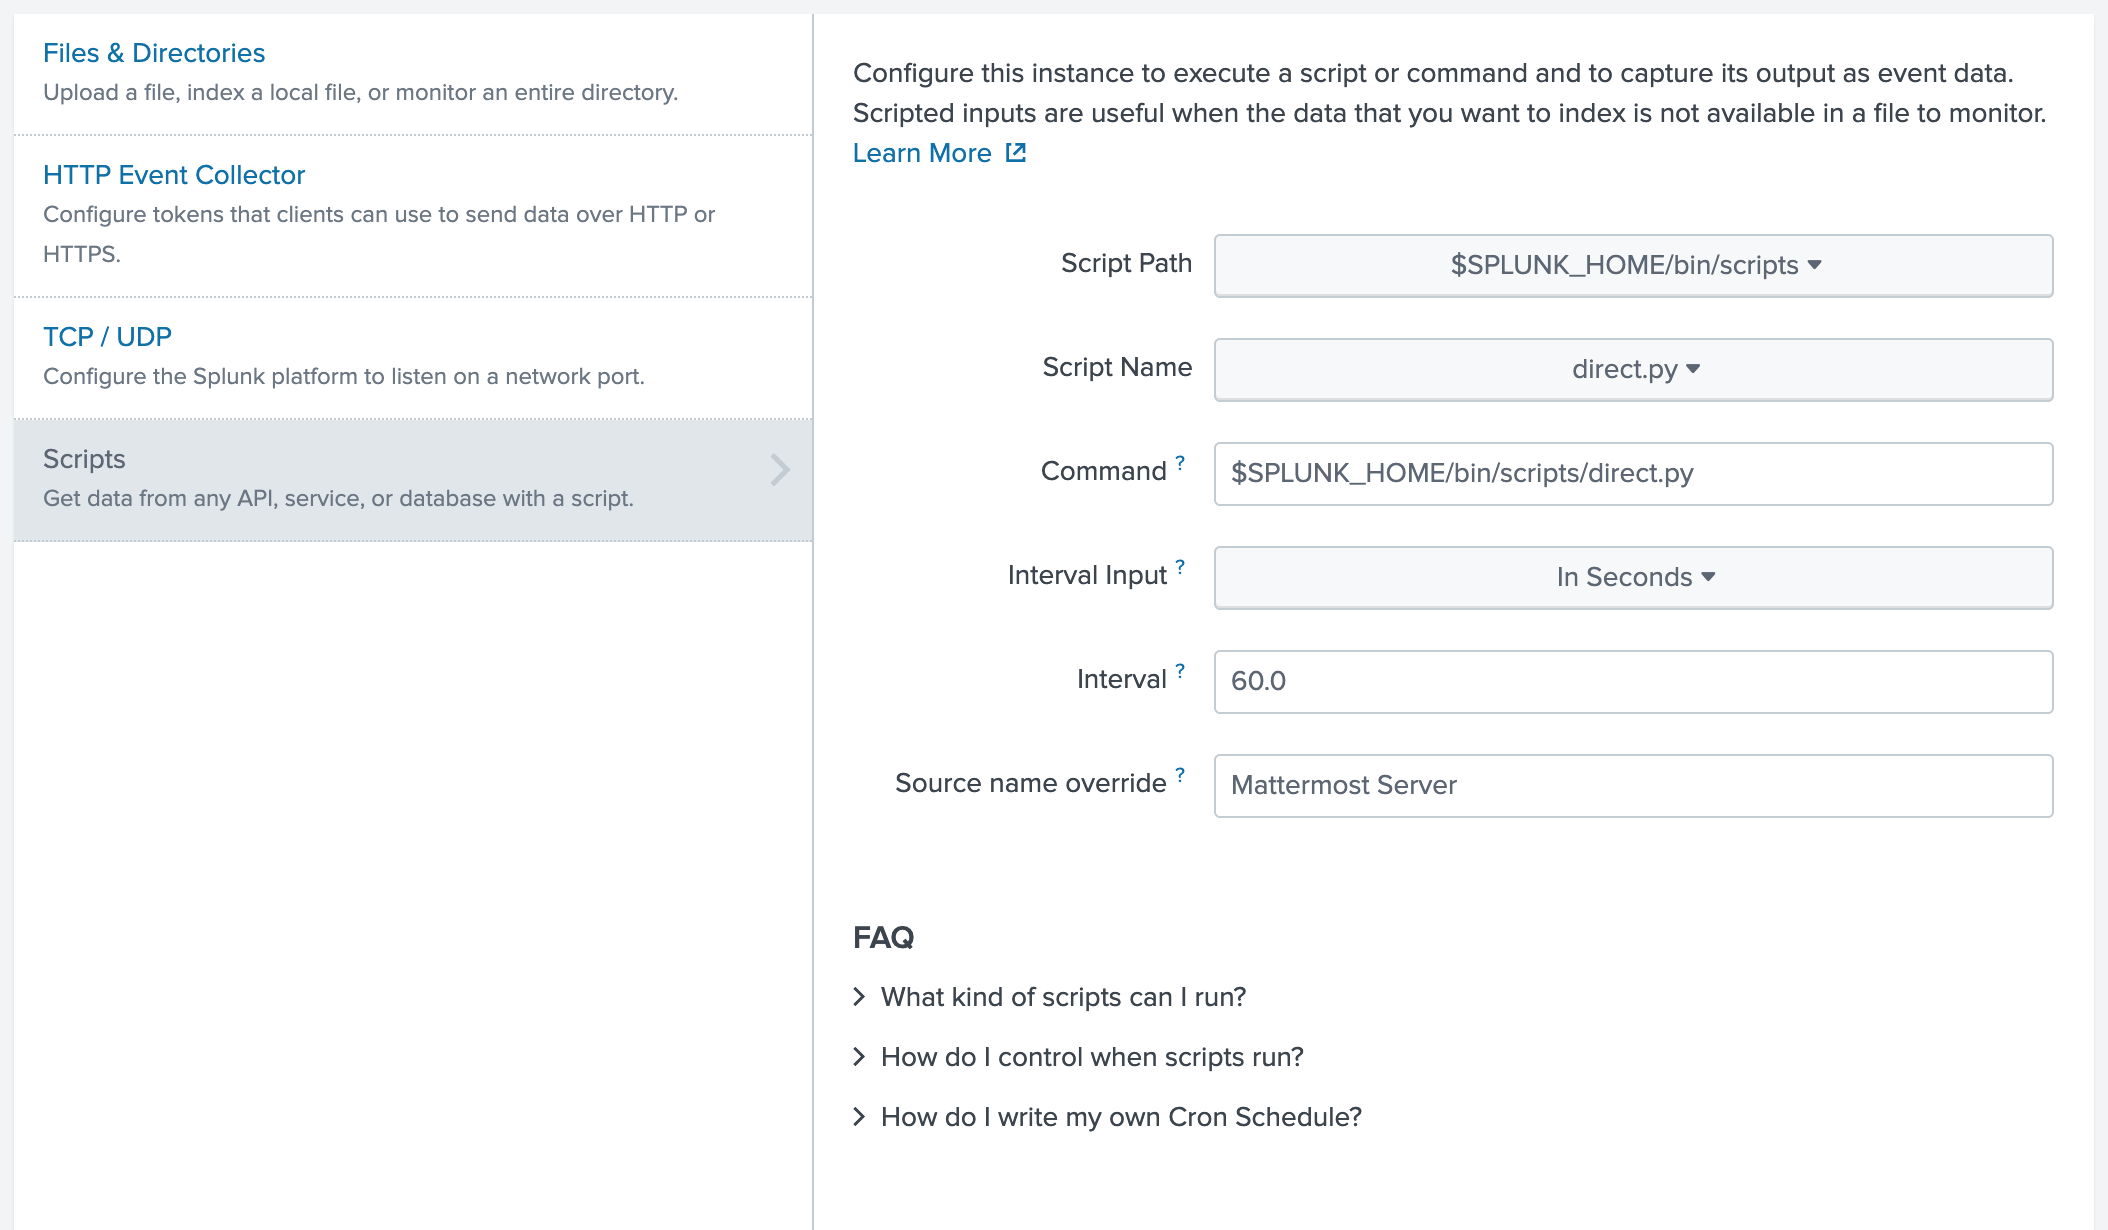
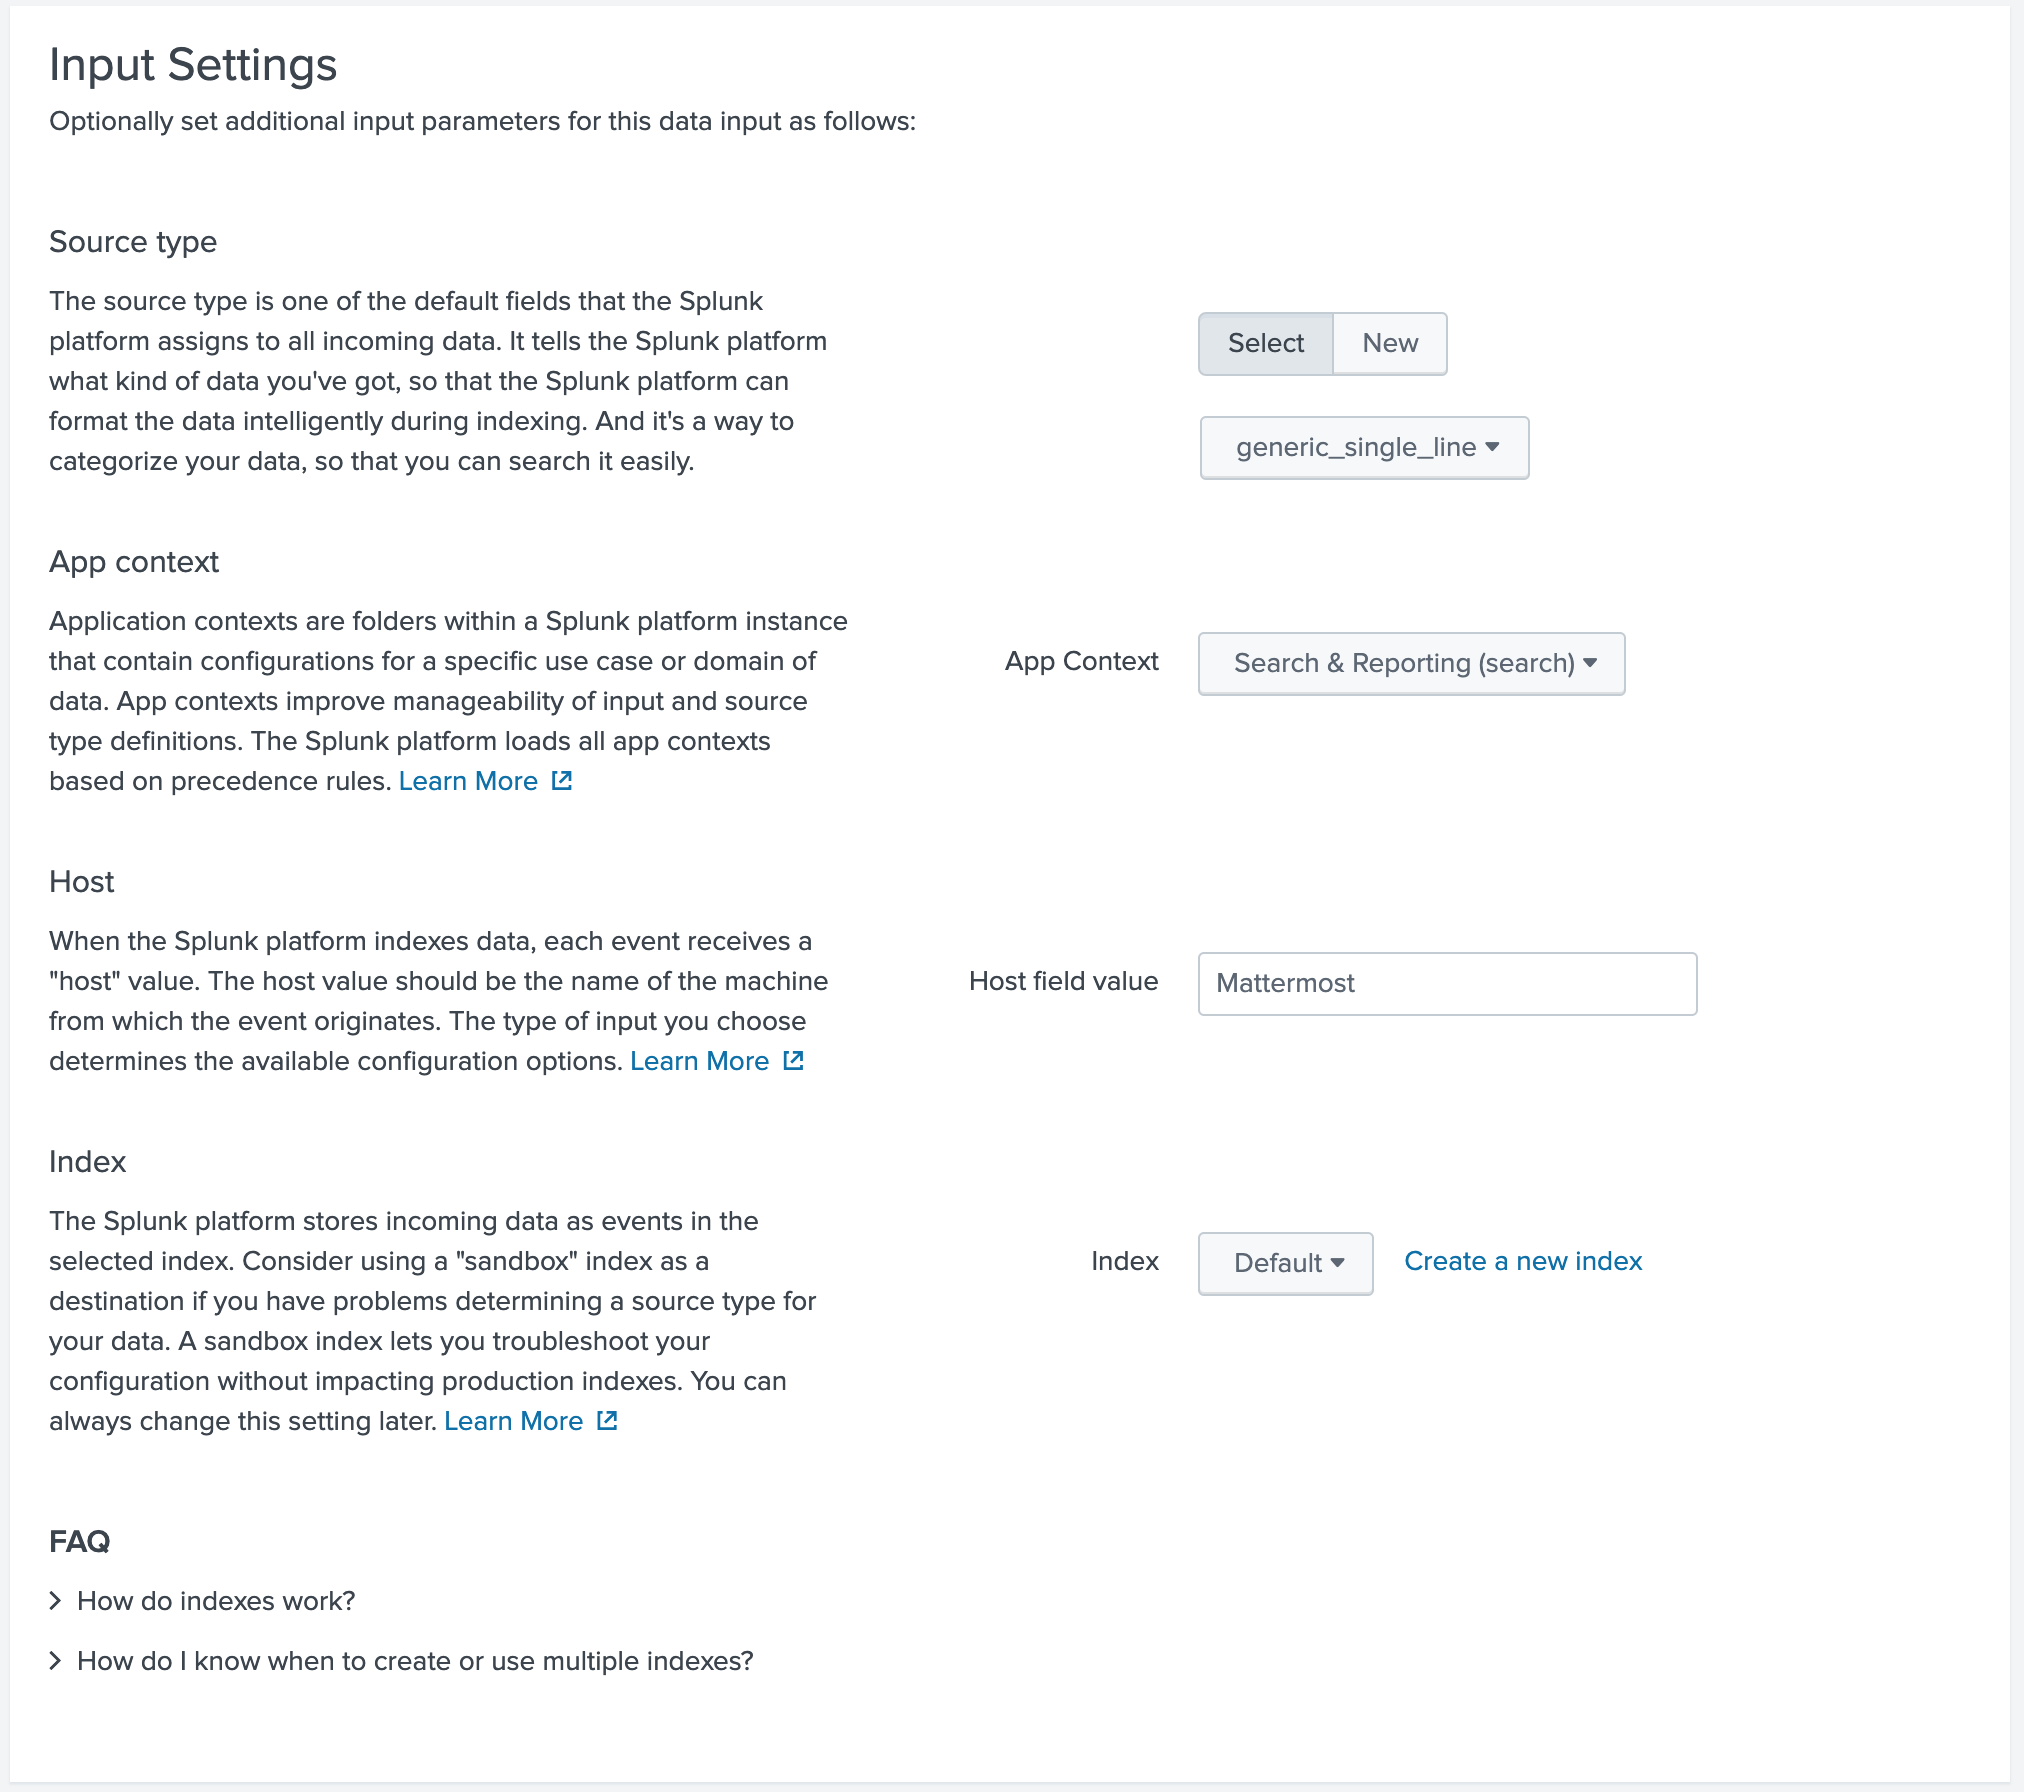
After clicking “Next” you can setup the input configuration details. Since this isn’t a standard syslog or logging format you can choose “generic_single_line” as source type and set the Host value to “Mattermost”.
No hit “Review” to check the details of the stanca.
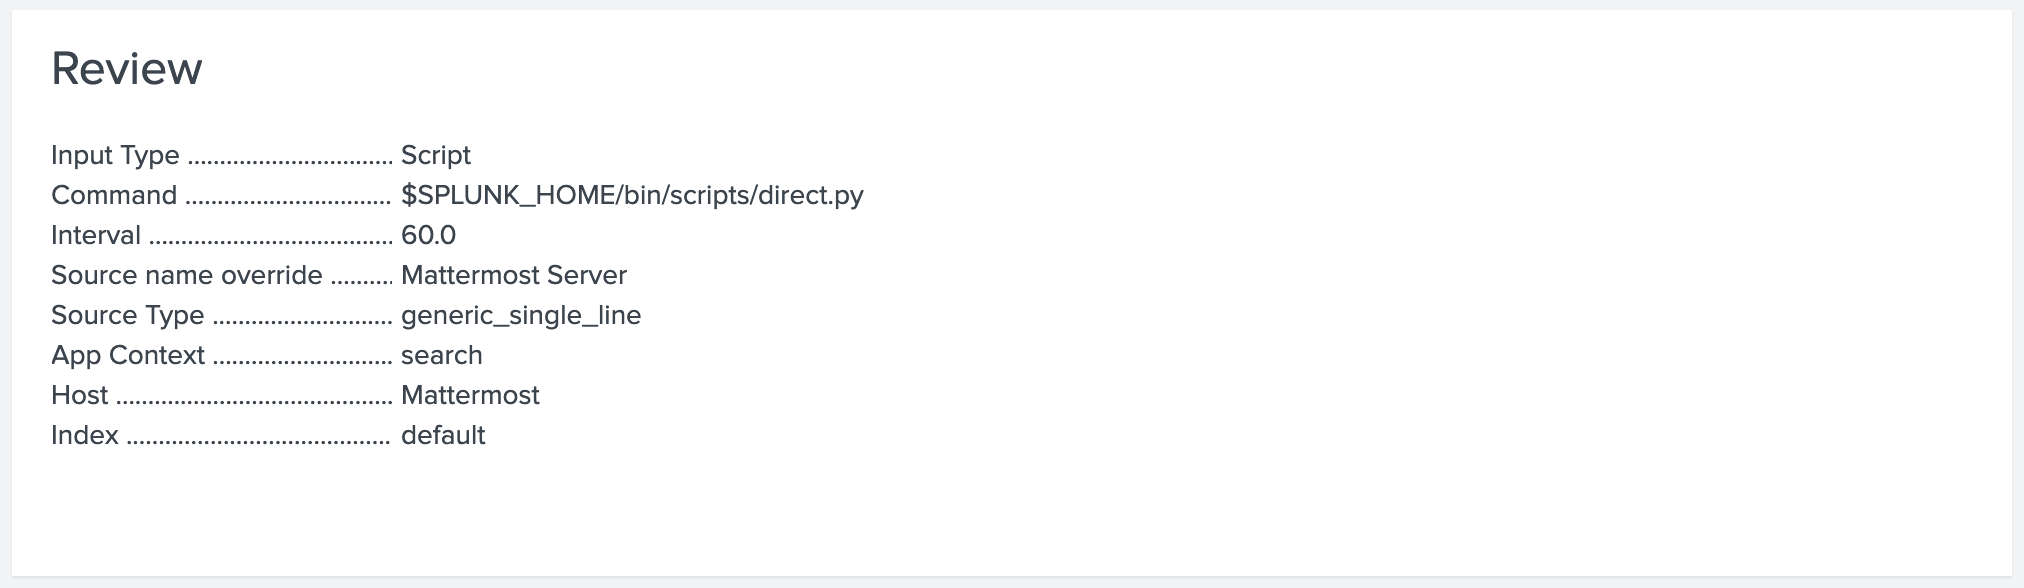
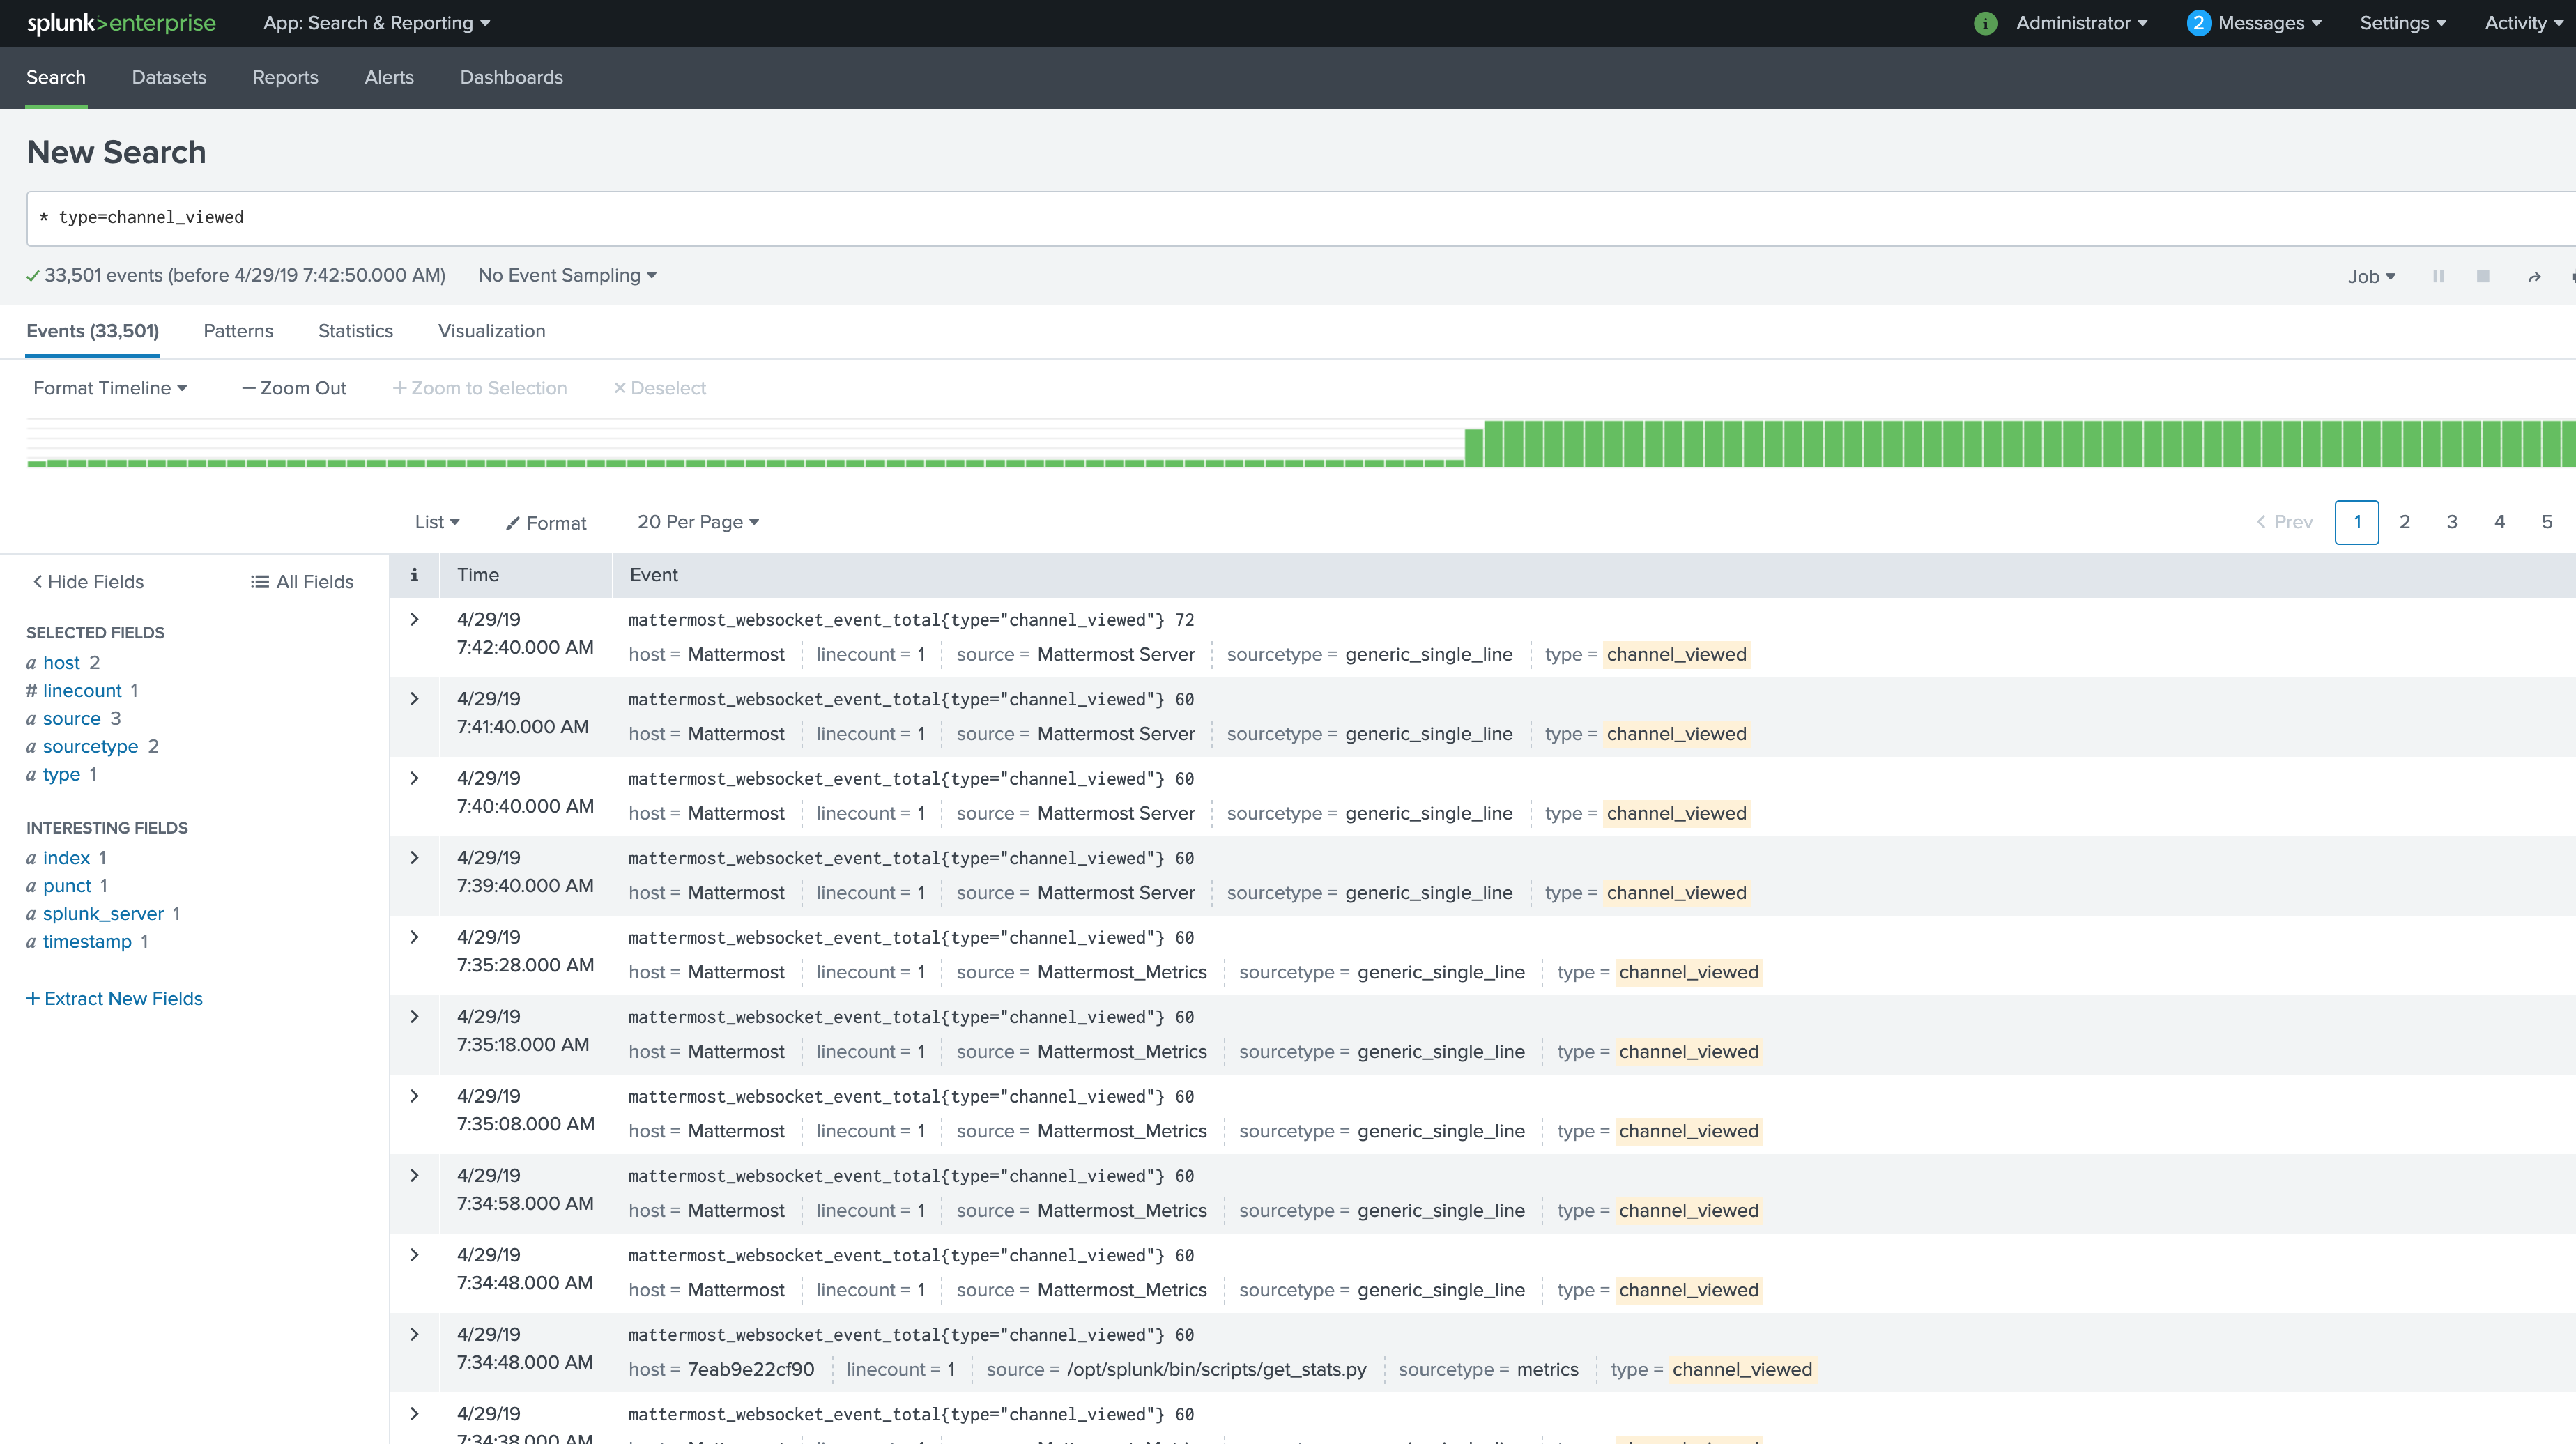
If everything looks good just hit the “Submit” button and the scripted input configuration is finished. Now you can click “Start Searching” and you will see the first results:
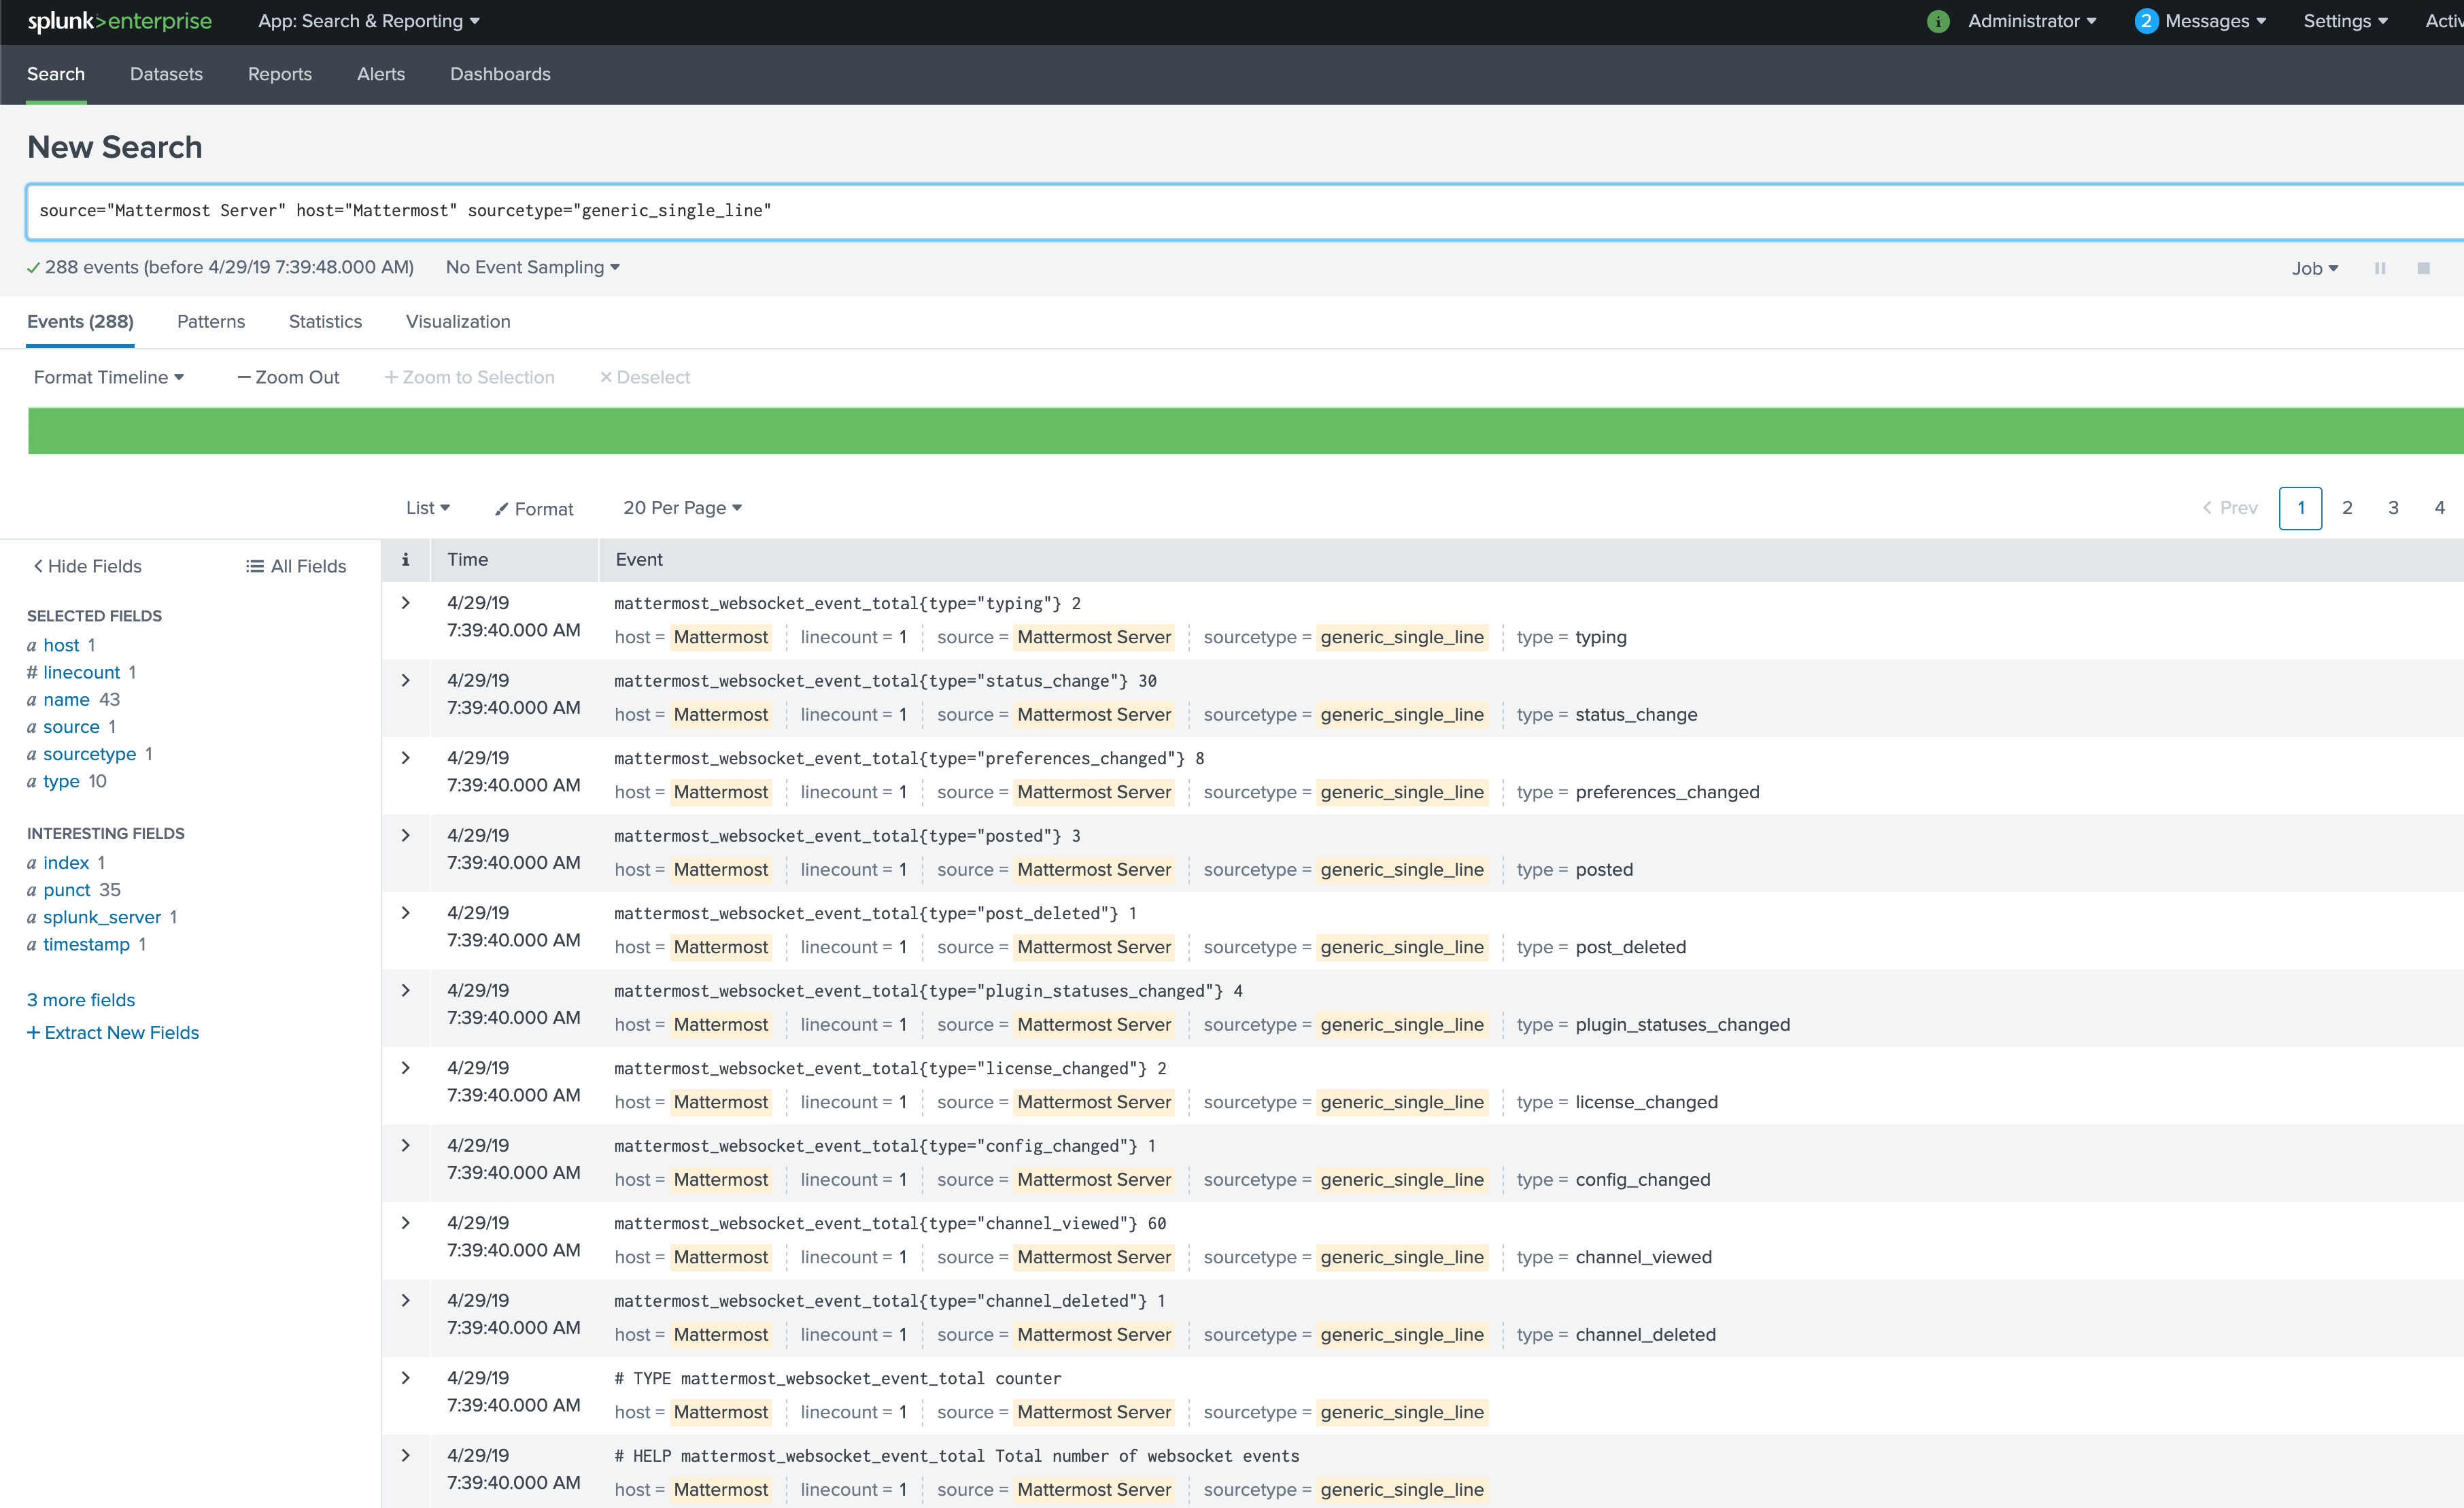
As you can see Splunk already checked that the sourcetype = generic_single_line has other types like type = channel_viewed which can be clicked to reduce the results:
Hope this helps!